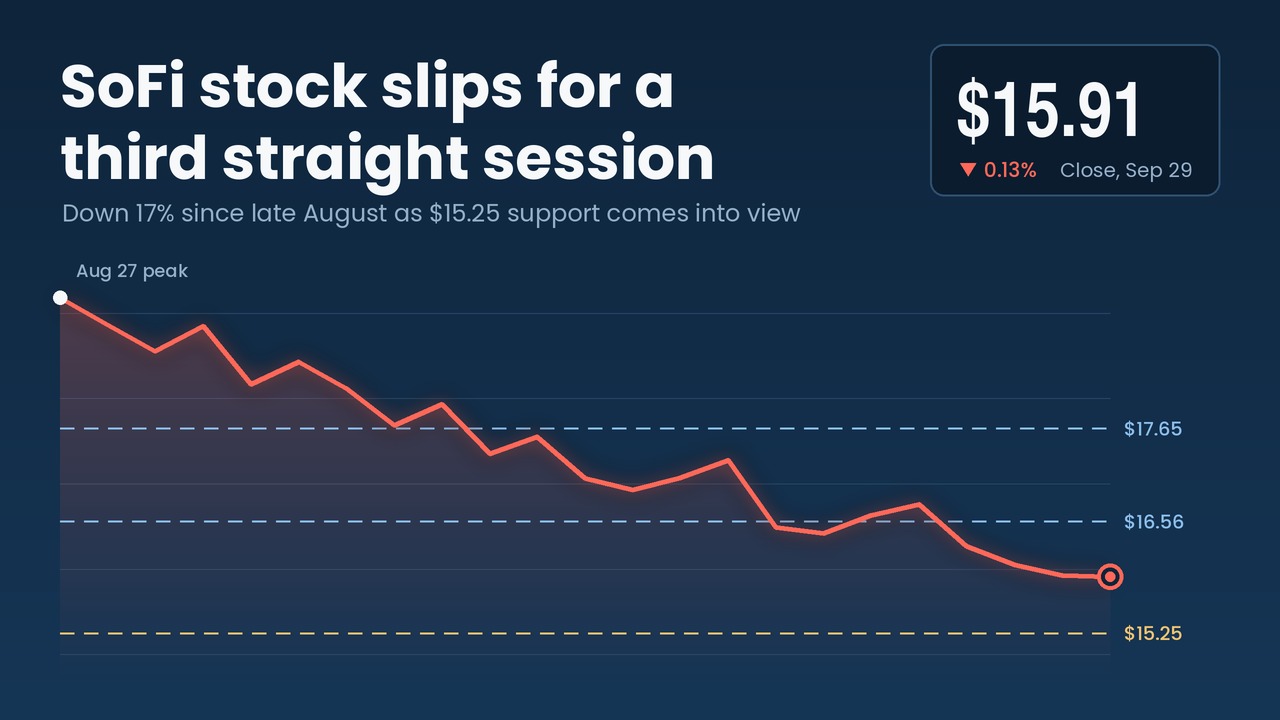
SoFi stock closed at $15.91 on Tuesday, September 29, 2026, down two cents from Monday’s $15.93. The 0.126% decline was small, but it marked the third straight losing session for the fintech lender and added to a slide that has erased more than a sixth of the stock’s value since late August.
The pullback didn’t happen in a straight line. Shares traded as high as $16.21 during the day before sellers pushed them back toward the session low of $15.86, a swing of $0.35, or 2.21%. Trading activity also eased: about 36 million shares changed hands, worth roughly $566.56 million, which was about 22 million fewer shares than in the prior session.
Looking ahead, the technical picture in the source report points to more weakness in the near term. Traders are now watching a support zone near $15.25 and resistance levels overhead at $16.56 and $17.65, all figures drawn from the report’s chart analysis and not guarantees of future price action.
Where the Stock Stands After Tuesday’s Session
All figures below are as of Tuesday’s close.
| Metric | Value |
|---|---|
| Closing price | $15.91 |
| Previous close | $15.93 |
| Daily change | -0.126% |
| Intraday range | $15.86 to $16.21 |
| Shares traded | About 36 million |
| Dollar volume | About $566.56 million |
| Consecutive down days | 3 |
| 10-day performance | -6.8% (down in 6 of 10 sessions) |
A Longer Slide Since Late August
Tuesday’s dip is part of a bigger move. According to the report, a sell signal formed at a pivot top on Thursday, August 27, 2026, and SoFi shares have dropped 17.05% since then. The analysis suggests the decline could continue until the stock establishes a new bottom pivot, a point where selling exhausts itself and buyers step back in.
Over the past 10 trading days alone, the stock has fallen 6.8%. The report describes SoFi as sitting in the middle of a very wide, falling short-term trend.
Why the Lower Volume Matters
Falling prices on lighter volume can mean something different from a sell-off on heavy trading. The report reads Tuesday’s pattern as a modestly reassuring sign, since volume moved in the same direction as price, which it says reduces overall risk. In other words, the decline did not come with a rush of sellers heading for the exits.
What the Technical Indicators Show
The report’s assessment of SoFi stock leans clearly negative. It finds few or no positive technical signals at the moment.
Moving Averages and MACD
The stock is showing sell signals from both its short-term and long-term moving averages. The long-term average also sits above the short-term average, which the report treats as a general sell signal. On top of that, the three-month Moving Average Convergence Divergence (MACD) indicator is flashing a sell signal as well.
Key Price Levels to Watch
| Level | Type | What the report says |
|---|---|---|
| $17.65 | Resistance | A break above could trigger a buy signal |
| $16.56 | Resistance | Nearest ceiling on any rebound |
| $15.25 | Support | Accumulated volume here may prompt an upward reaction |
The $15.25 level sits about 4% below Tuesday’s close. The report notes that a test of that support could present a buying opportunity if the level holds.
Three-Month Outlook
Based on the current short-term trend, the analysis projects SoFi stock could fall about 4.18% over the next three months. It assigns a 90% probability that the price will land between $14.07 and $18.10 at the end of that period. That range is wide, which reflects how uncertain these model-based projections are, and readers should treat it as a statistical estimate rather than a price target.
Analyst Coverage and Risk Profile
Loop Capital Starts at Hold
On September 8, 2026, Loop Capital Markets initiated coverage of SoFi (ticker: SOFI) with a Hold rating, according to the report. A Hold typically signals that an analyst expects the stock to perform roughly in line with the market and does not see a compelling reason to buy or sell at current levels.
Volatility Is Moderate
The report rates the stock’s risk as medium, citing average intraday movements and healthy trading volume. Over the past week, SoFi’s average daily volatility was 3.16%, somewhat higher than Tuesday’s 2.21% range.
Background on the Company
SoFi Technologies is a San Francisco-based financial services company that began in student loan refinancing and has since expanded into personal loans, mortgages, checking and savings accounts, credit cards, and investing. It became a bank holding company in 2022 after acquiring Golden Pacific Bancorp, which allowed it to operate as a nationally chartered bank. Its shares trade on the Nasdaq.
The Bottom Line
The report concludes that SoFi carries several negative signals and remains in a wide downward trend, and it expects the stock to stay weak over the coming days or weeks. It holds a negative evaluation for now. A move back above $16.56 would be the first sign that the pattern is changing, while a break below $15.25 would put the lower end of the projected range in play.
Disclaimer: This content was partially produced with the help of AI tools and This content is for informational purposes only and not investment advice.