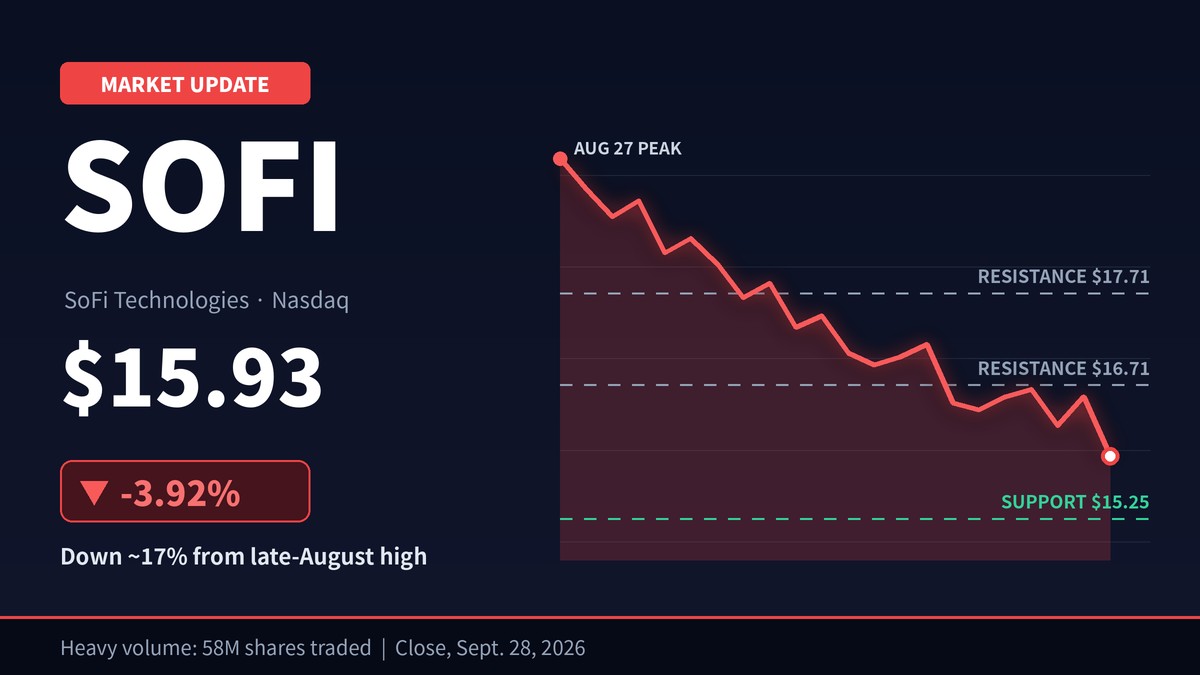
Shares of SoFi Technologies closed at $15.93 on Monday, September 28, 2026, down 3.92% from the previous close of $16.58. The loss matters because it came on noticeably heavier trading, a pattern technical analysts often read as sellers gaining conviction rather than a quiet drift lower.
About 58 million shares changed hands during the session, roughly 27 million more than the prior trading day, for total dollar volume near $925 million. SoFi stock swung between a low of $15.87 and a high of $16.42, a 3.47% intraday range, and finished only a few cents above the day’s bottom.
The drop extends a rough stretch. The shares have fallen in six of the last ten sessions, losing 9.75% over that span, and are down nearly 17% since a late-August peak. The next test, according to the technical analysis report behind these figures, is a support zone near $15.25.
Monday’s Trading at a Glance
| Metric | Value |
|---|---|
| Previous close | $16.58 |
| Closing price | $15.93 |
| Daily change | -3.92% |
| Intraday low / high | $15.87 / $16.42 |
| Intraday range | $0.55 (3.47%) |
| Shares traded | About 58 million |
| Dollar volume | About $925.26 million |
| 10-day performance | -9.75% (6 of 10 days lower) |
Why the Volume Stands Out
Rising volume on a down day tends to draw more attention than the price move alone. The report flagged Monday’s jump in activity as a possible early warning and said near-term risk may rise slightly over the next couple of days. Volume signals are not predictive on their own, though, and heavier trading can accompany both continued selling and short-term lows.
A Slide That Began in Late August
The report identifies Thursday, August 27, 2026, as a pivot top, the point at which a sell signal was triggered. SoFi stock has fallen 16.94% since then, which implies a peak near $19.18 based on Monday’s close. The report said further declines are indicated until a new bottom pivot forms.
Moving Averages and Momentum
Several standard indicators point the same way. The shares trade below both their short-term and long-term moving averages, and the long-term average sits above the short-term one, a setup generally treated as a broad sell signal. The three-month Moving Average Convergence Divergence (MACD) indicator is also flashing a sell signal. Positive technical signals, the report said, are few to none at the moment.
Price Levels to Watch
| Level | Type | Distance from Monday’s close |
|---|---|---|
| $17.71 | Resistance | About +11.2% |
| $16.71 | Resistance | About +4.9% |
| $15.25 | Support (accumulated volume) | About -4.3% |
On the upside, the report said a break above either resistance line would generate buy signals. On the downside, the $15.25 area has seen substantial past trading activity, and the report suggested buyers may step in if that level is tested.
What the Three-Month Projection Shows
Based on the current short-term trend, the report’s model projects a 3.62% decline over the next three months, which would leave the shares around $15.35. It assigns a 90% probability that the price will sit between $14.24 and $18.26 at the end of that period.
How to Read the Forecast
That band spans roughly $4, which reflects how much the shares move. Daily volatility averaged 3.84% over the past week, which the report describes as average intraday movement. Paired with strong trading volume, it rates overall risk as medium. Trend-based projections assume current conditions hold, and they can shift quickly on company news, earnings results, or broader market moves.
Where Analysts Stand
Loop Capital Opens Coverage at Hold
On September 8, 2026, Loop Capital Markets initiated coverage of SoFi with a Hold rating, according to the report. The source did not include a price target.
The report’s own assessment is negative. Citing multiple sell signals and a wide, falling trend, it said it expects the shares to keep performing weakly over the coming days or weeks.
About SoFi Technologies
SoFi Technologies is a San Francisco-based digital financial services company whose shares trade on the Nasdaq under the ticker SOFI. It offers personal, student, and home loans alongside banking, investing, and credit card products, and it has operated a nationally chartered bank since 2022. Because lending sits at the center of its business, investors often track SoFi stock alongside interest rate expectations and credit conditions.
Disclaimer: This content was partially produced with the help of AI tools and This content is for informational purposes only and not investment advice.