
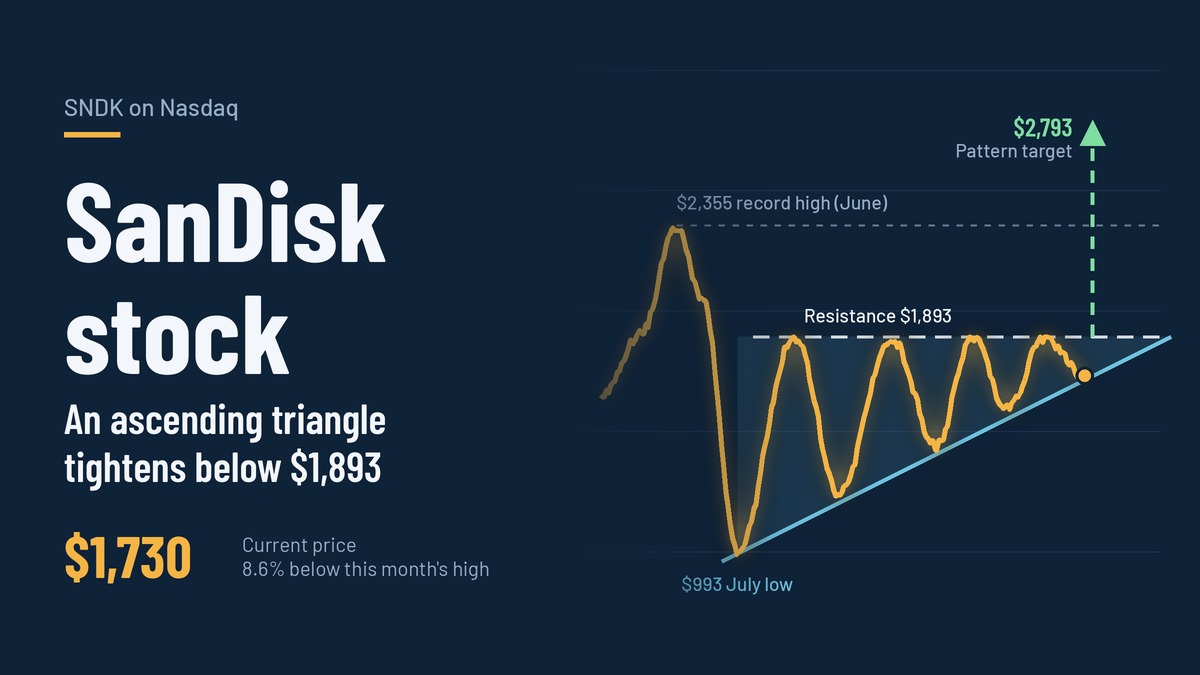
SanDisk stock has spent the past several weeks stuck in a narrowing range, trading near $1,730 after failing to clear this month’s high of $1,893. The pause comes after an extraordinary run, and it now sets up a clear test: whether buyers can push the shares through a ceiling they have repeatedly hit.
The numbers behind the stall are striking. Shares sit about 8.6% below that monthly high but roughly 74% above the July low of $993, a level reached after a steep fall from June’s record of $2,355. That round trip, a drop of nearly 58% followed by a sharp recovery, explains why traders are watching the current range so closely.
What happens next likely depends on two things: the company’s upcoming earnings report, where Wall Street expects revenue to more than quadruple from a year earlier, and whether the chart pattern that has formed during the consolidation resolves upward or breaks down.
Where the shares stand now
SanDisk, which began trading on Nasdaq under the ticker SNDK after its spinoff from Western Digital in February 2025, has become one of the most volatile names in the memory sector. The table below shows the key price levels in the source report, as of its publication.
| Level | Price | Distance from $1,730 |
|---|---|---|
| All-time high (June) | $2,355 | +36.1% |
| Recent resistance (this month’s high) | $1,893 | +9.4% |
| Current price | $1,730 | n/a |
| July low | $993 | -42.6% |
The ascending triangle setup
Since the July bottom, the stock has made a series of higher lows while repeatedly stalling near $1,893. Technical analysts call this shape an ascending triangle: a flat upper boundary paired with a rising lower trendline. The pattern is often read as bullish, because it suggests buyers are stepping in at progressively higher prices while sellers hold a fixed line.
A common way to estimate a breakout target is to measure the triangle’s height and add it to the resistance level. Here, the distance between $993 and $1,893 is about $900, which points to a potential target near $2,793. According to the analysis, a move above the $2,355 record would serve as confirmation that the breakout is real.
The shares also remain above their major moving averages and the Supertrend indicator, both signs that the broader trend has not turned negative.
Why chart patterns are not guarantees
Triangle targets are projections, not forecasts. Patterns can fail, and a decisive close below the rising trendline would undercut the bullish reading. Given how quickly SanDisk shares fell from June to July, readers should treat technical targets as one input among several.
The business case behind the rally
The fundamentals are doing most of the heavy lifting. In its most recent quarter, SanDisk reported revenue of $8.9 billion, up 372% from a year earlier. Data center revenue rose 1,298%, while the edge segment grew 392%. Management raised its forward guidance, pointing to sustained demand and large agreements with some of the biggest companies in the United States.
What analysts expect next
Consensus estimates cited in the report call for continued, if slightly slower, growth.
| Metric | Estimate | Growth |
|---|---|---|
| Upcoming quarter revenue | $10.68 billion | +362% |
| Following quarter revenue | $12.2 billion | +304% |
| Annual revenue (this year) | $48 billion | n/a |
| Annual revenue (next year) | $58 billion | n/a |
| Quarterly EPS | $46.18 | up from $1.22 |
| Annual EPS | $213 | up from $70 |
Contracts that smooth the memory cycle
One detail separates this cycle from past memory booms. Analysts highlight SanDisk’s long-term agreements with major customers, which reportedly set both a floor and a ceiling on chip prices. If those terms hold, they could reduce the company’s exposure to the sharp boom-and-bust swings that have historically battered memory makers.
Valuation and Wall Street targets
Despite the rally, SanDisk stock trades at a forward price-to-earnings ratio of about 8, compared with a technology sector median of 23.20. The report also describes the multiple as well below peers including Micron, Kioxia, and Samsung Electronics. A low multiple on rapidly rising earnings estimates can signal opportunity, but it can also reflect investor doubt that peak-level profits will last.
Price targets vary widely, and not all of them imply large gains from here.
| Firm | Price target | Implied move from $1,730 |
|---|---|---|
| Cantor Fitzgerald | $2,900 | +67.6% |
| Rosenblatt (Kevin Cassidy, raised) | $2,400 | +38.7% |
| Wedbush | $2,000 | +15.6% |
| Mizuho | $1,875 | +8.4% |
Notably, Mizuho’s target sits just below the $1,893 resistance level, a reminder that the bullish case is not unanimous in its magnitude. The spread between the highest and lowest targets, more than $1,000, reflects real uncertainty about how long the current demand surge for data center storage can continue.
For now, SanDisk stock remains a story of exceptional growth meeting an unresolved chart. The next earnings release is likely to decide which way the range breaks.
Disclaimer: This content was partially produced with the help of AI tools and This content is for informational purposes only and not investment advice.