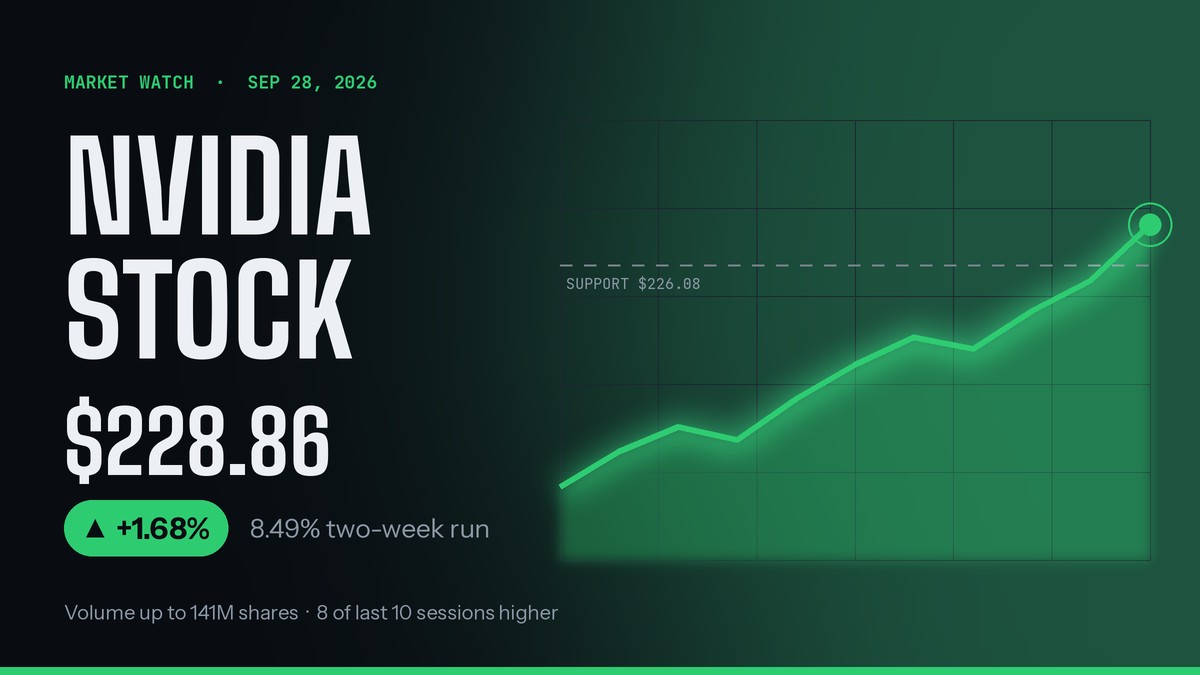
NVIDIA stock closed Monday, September 28, 2026, at $228.86, up 1.68% from its previous close of $225.07. The gain extended a run that has lifted shares 8.49% over the past two weeks. It also came with a sharp jump in trading activity, which traders watch closely to judge whether a rally has real participation behind it.
About 141 million shares changed hands during the session, roughly 54 million more than the day before. That put the value of Monday’s trading at an estimated $32.23 billion. The stock has now finished higher in 8 of its last 10 sessions.
Not every indicator points the same direction, though. A technical analysis report on the move flags several buy signals alongside two sell signals, and it places the nearest support levels only a few dollars below Monday’s close. How the shares behave near those levels in the coming sessions will test the strength of the current trend.
Inside Monday’s Session
| Metric | Value |
|---|---|
| Previous close | $225.07 |
| Monday close | $228.86 |
| Daily change | +$3.79 (+1.68%) |
| Session low | $228.04 |
| Session high | $233.21 |
| Intraday range | $5.17 (2.27%) |
| Shares traded | ~141 million |
| Estimated dollar volume | ~$32.23 billion |
The intraday numbers tell a more mixed story than the headline gain. Shares reached $233.21 at their peak but closed $4.35 below that level, much nearer the session low than the high. Buyers pushed the price up early but did not hold the day’s best levels into the close.
Why the Volume Jump Matters
Based on the figures in the report, the prior session saw roughly 87 million shares traded, which means Monday’s volume rose by about 62%. In technical analysis, rising prices paired with rising volume are generally read as confirmation that a move has broad support rather than being driven by a small number of trades. The report describes this combination as a positive technical sign.
What the Technical Signals Show
Moving Averages Favor Buyers
According to the report, NVIDIA stock currently holds buy signals from both its short-term and long-term moving averages. The short-term average also sits above the long-term average, a relationship analysts treat as a general buy signal on its own. The report places the shares in the middle of a wide, strong rising trend in the short term.
Two Sell Signals Complicate the Picture
The report also identifies warning signs. A sell signal was issued from a pivot top on Friday, September 4, 2026, and the report indicates further weakness until a new bottom pivot forms. It notes the stock has fallen 0.651% since that signal, though that figure sits awkwardly beside the 8.49% two-week gain, so readers should treat the measurement with some caution.
The second warning comes from the three-month Moving Average Convergence Divergence indicator, or MACD, which is currently flashing a sell signal.
What a MACD Sell Signal Means
MACD compares two moving averages of a stock’s price to measure momentum. A sell signal typically appears when the faster-moving line crosses below its signal line, suggesting upward momentum is fading even if the price is still rising. It is a momentum warning, not a prediction of a decline.
Support Levels to Watch
The report highlights three price levels where buying interest may emerge on a pullback.
| Support level | Type | Distance below Monday close |
|---|---|---|
| $227.98 | Accumulated volume support | $0.88 |
| $226.08 | Moving average support | $2.78 |
| $220.76 | Moving average support | $8.10 |
The report suggests the $227.98 level could draw buyers when tested, since a large amount of trading has previously occurred there. It adds that a break below either $226.08 or $220.76 would trigger new sell signals. With the nearest level less than a dollar below Monday’s close, even a modest dip would put these supports to the test quickly.
Analyst Coverage and the Three-Month Projection
On September 11, 2026, RBC Capital was reported to have initiated coverage of NVIDIA with an “Outperform” rating. The report did not include a price target alongside the rating.
Based on the current short-term trend, the report projects a 13.33% rise for NVIDIA stock over the next three months. It also estimates, with 90% probability, that the shares will trade between $236.40 and $268.59 at the end of that period. The low end of that range sits about 3.3% above Monday’s close, and the high end about 17.4% above it.
These figures are statistical projections built on the assumption that the existing trend continues. A reversal in that trend, or a break below the support levels above, would make them unreliable.
Volatility Profile
The report classifies NVIDIA as a low-risk stock from a trading standpoint, citing consistently strong volume and relatively small daily moves. Average daily volatility over the past week was 1.89%, slightly below Monday’s 2.27% intraday swing. The report concludes that its short-term signals, combined with the broader trend, point toward a fair chance of near-term strength, while acknowledging the sell signals that could weigh on the stock in the days ahead.
Disclaimer: This content was partially produced with the help of AI tools and This content is for informational purposes only and not investment advice.