
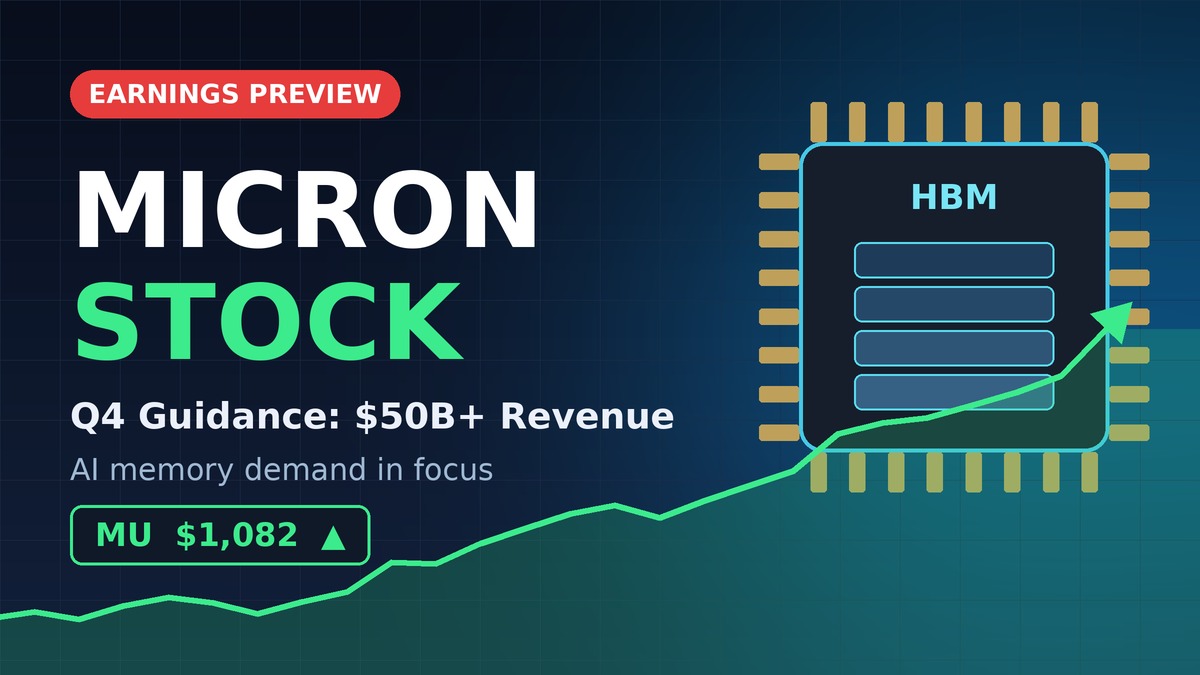
Micron Technology reports fiscal fourth-quarter results this week, and the memory chipmaker enters the release after a sharp rebound. Micron stock recently traded near $1,082, according to the original market report. That’s about 47% above its July low of $737, and the key question now is whether the numbers can support that run.
The bar is high. Management has guided to fourth-quarter revenue above $50 billion, which would represent roughly 325% growth from a year earlier. Analysts on average expect slightly more, with consensus above $51 billion.
Investors will also be looking past the headline figure. They want signs that demand for high-bandwidth memory in AI data centers is holding firm and that Micron’s pricing power will carry into the next fiscal year. The stock’s valuation and recent chart pattern add further context.
What the Fourth-Quarter Report Needs to Show
Revenue and earnings expectations
Micron’s third-quarter report set a demanding baseline. Revenue jumped 346% to $41.5 billion, beating both analyst estimates and the company’s own guidance.
| Metric | Figure |
|---|---|
| Q3 revenue (reported) | $41.5 billion, up 346% |
| Q4 revenue guidance | Above $50 billion (about 325% growth) |
| Analyst consensus, Q4 revenue | Above $51 billion |
| Analyst consensus, Q4 EPS | $31.59 |
| Year-ago Q4 EPS | $3.03 |
If Micron hits the consensus earnings estimate, profit per share would grow more than tenfold year over year. The original analysis projected that actual revenue could land near $55 billion. That figure is one writer’s estimate, not company guidance or analyst consensus, and readers should treat it that way.
Why HBM demand is driving the numbers
High-bandwidth memory, or HBM, is stacked right next to the processors in AI accelerators. It feeds them data far faster than conventional memory. Micron is one of only three major HBM suppliers, alongside SK Hynix and Samsung.
According to the report, strong demand combined with tight supply has let Micron raise prices without losing market share. This is the main reason revenue growth has outpaced even optimistic forecasts.
Cyclical context
Memory chips have historically been a boom-and-bust business. Shortages have typically been followed by periods of oversupply and falling prices. The current cycle is being shaped by AI infrastructure spending, so guidance on capacity plans and customer commitments may matter as much as the quarter’s results.
How Analysts Value Micron Stock
Price targets
Wall Street coverage remains largely bullish, according to the original report. Several firms have set targets well above the current price.
| Firm | Price target | Implied upside from $1,082 |
|---|---|---|
| Rosenblatt | $1,500 | About 39% |
| Wells Fargo | $1,400 | About 29% |
| Cantor Fitzgerald | $2,000 | About 85% |
| Barclays | $2,000 | About 85% |
Valuation multiples
Bulls argue the shares remain inexpensive relative to their growth, even after the rally.
Micron’s forward price-to-earnings ratio stands at 14.70. That compares with a sector median of 25 and an S&P 500 average of about 19. The forward PEG ratio, which adjusts the P/E for expected earnings growth, is 0.03, against a sector median of 0.68.
Adding the company’s revenue growth rate to its profit margin produces a combined figure of 390%, the report noted. That’s nearly ten times the common 40% benchmark.
What the Rule of 40 measures
The “Rule of 40” is a shorthand investors use to judge growth companies. If revenue growth plus profit margin exceeds 40%, the business is generally considered to be balancing expansion and profitability well. A reading of 390% reflects just how extreme Micron’s current growth rate is. It also shows how much depends on that growth continuing.
What the Chart Shows
Ascending triangle breakout
On the daily chart, Micron stock has pushed above the upper boundary of an ascending triangle. This pattern is formed by a flat resistance line and a rising trendline beneath it. Technical analysts generally read it as a bullish continuation signal, since buyers keep stepping in at higher prices until resistance gives way.
The shares have also moved above their 50-day exponential moving average. Meanwhile, the Relative Strength Index has been trending higher within a rising channel.
Levels traders are watching
The next major reference point is $1,255, the stock’s June 25 high. The original analysis identified a move above that level as a possible path toward $1,500.
Chart patterns describe past price behavior, not guaranteed outcomes. Earnings results and forward guidance can quickly override any technical setup in either direction.
Disclaimer: This content was partially produced with the help of AI tools and This content is for informational purposes only and not investment advice.