
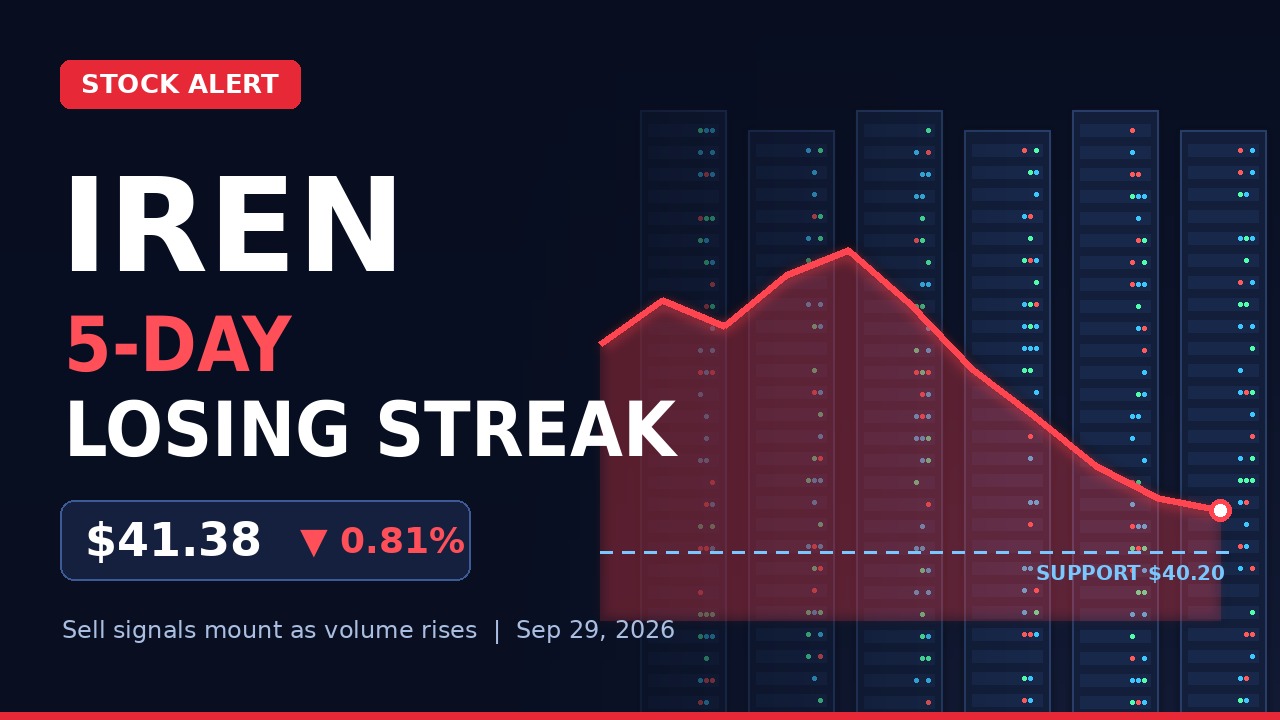
Shares of IREN Limited closed lower on Tuesday, September 29, 2026, stretching their losing streak to five consecutive sessions. The Nasdaq-listed data center operator finished at $41.38, down 0.81% from Monday’s close of $41.72, and a widely circulated technical analysis kept its outlook negative.
The drop looks small on paper, but the session was far from calm. The stock swung between $40.98 and $42.85, a range of 4.56%, and about 34 million shares traded hands, worth roughly $1.39 billion. That was 8 million more shares than the day before. Technical analysts often treat heavier volume on a down day as a warning sign, because it suggests sellers were motivated rather than simply absent buyers.
For IREN Limited stock, the near-term picture is now a tug-of-war. A strong short-term uptrend remains intact, while a growing list of indicators points lower. The same analysis upgraded its overall rating from “Strong Sell” to “Sell.” That’s a modest improvement, and it stops well short of a positive call.
Tuesday’s trading at a glance
All figures below are as of the close on Tuesday, September 29, 2026.
| Metric | Value |
|---|---|
| Closing price | $41.38 |
| Previous close | $41.72 |
| Daily change | -0.81% |
| Intraday range | $40.98 to $42.85 ($1.87, or 4.56%) |
| Shares traded | About 34 million |
| Dollar volume | About $1.39 billion |
| Change over two weeks | -0.48% |
| Consecutive down sessions | 5 |
Volume climbed as the price fell
The rise in trading activity is the detail the analysis flagged most prominently. It described the combination of rising volume and a falling price as a possible early warning. It also said risk could increase slightly over the next couple of days and that the stock deserves closer monitoring.
Why the signals are mixed
The disagreement comes down to time frame. Over the short-term trend, IREN sits in the middle of what the report calls a very wide and strong rising channel. Based on that trend alone, the model projects a 12.55% gain over the next three months. It gives a 90% probability that the price will land between $37.18 and $55.13 by the end of that period.
That range is wide, and it’s a statistical projection rather than a price target. Readers should treat it as a measure of how much the stock could move, not as a forecast of where it will go.
Moving averages and momentum lean negative
Most shorter-term indicators are pointing the other way. The stock is flashing sell signals from both its short-term and long-term moving averages, and the three-month MACD, a momentum gauge, also issued a sell signal. The report said there are few to no positive technical signals right now.
The sharpest move came after a pivot top on Tuesday, September 22, 2026. The shares have fallen 14.77% since that high. The analysis suggests the decline could continue until a new bottom pivot forms.
Price levels traders are watching
On the downside, accumulated trading volume points to support around $40.20. Tuesday’s intraday low of $40.98 came within about 2% of that level. The report said a test of support there could produce an upward reaction and possibly a buying opportunity.
On the upside, resistance sits at $42.78 and then $45.17. A move above either one would generate buy signals, according to the analysis. Tuesday’s high of $42.85 briefly poked above the first level, but the stock couldn’t hold it into the close.
Analysts and the chart tell different stories
Fundamental coverage has been more constructive than the technical readings. On September 14, 2026, BTIG was reported to have kept its “Buy” rating on IREN, with the action classified as a “hold.” In practice, that means the firm maintained its existing view rather than changing it.
The gap matters. Technical models react to price and volume patterns over days and weeks, while brokerage ratings usually reflect a longer view of the company’s business. The two can diverge for extended periods.
What the rating upgrade actually means
Moving from “Strong Sell” to “Sell” reflects a slight easing in the model’s negative reading, not a reversal. The analysis still expects IREN Limited stock to perform weakly over the next few days or weeks and said it holds a negative evaluation overall.
A high-risk stock by design
Volatility is part of the IREN story. Because of its large daily swings and a wide Bollinger Band prediction interval, the report classifies the shares as “high risk.” Over the past week, the stock’s average daily move was 5.40%. For comparison, many large, established companies rarely move that much in a single session.
About IREN Limited
IREN Limited, formerly known as Iris Energy, is headquartered in Sydney, Australia, and trades on the Nasdaq under the ticker IREN. The company builds and operates large data centers that were originally focused on Bitcoin mining. In recent years, it has shifted a growing share of its capacity toward AI cloud computing. Its sensitivity to both cryptocurrency prices and sentiment around AI infrastructure helps explain why the shares tend to move sharply in both directions.
Disclaimer: This content was partially produced with the help of AI tools and This content is for informational purposes only and not investment advice.